
Understand model costs
AgentX itself is free, but the AI models your agents use are not. Each time an agent reads a message, looks at its context or writes a reply, your model provider may charge you. The amount depends on the model, how much text it reads, and how often work runs.
The scripted demo never calls a paid model, so it costs nothing.
Keep in mind:
- A schedule (a job that runs at set times) spends money even when nobody sends a message. Start with a schedule that runs rarely, check its first runs, then make it more frequent.
- Monitor's automatic reviewer also uses Claude Code, separately from the agents' own work. The demo turns that reviewer off.
- AgentX doesn't change your provider's prices. Check your provider's billing page for the real amounts.
See what your agents spent
- Browser: open
/admin/coston your dashboard (for examplehttp://127.0.0.1:4202/admin/cost). - Pick a period at the top right: 7d, 14d, 30d, 90d or All.
- Read the totals, then Top agents by spend.
- To keep a copy or compare with your bill, select Export CSV.
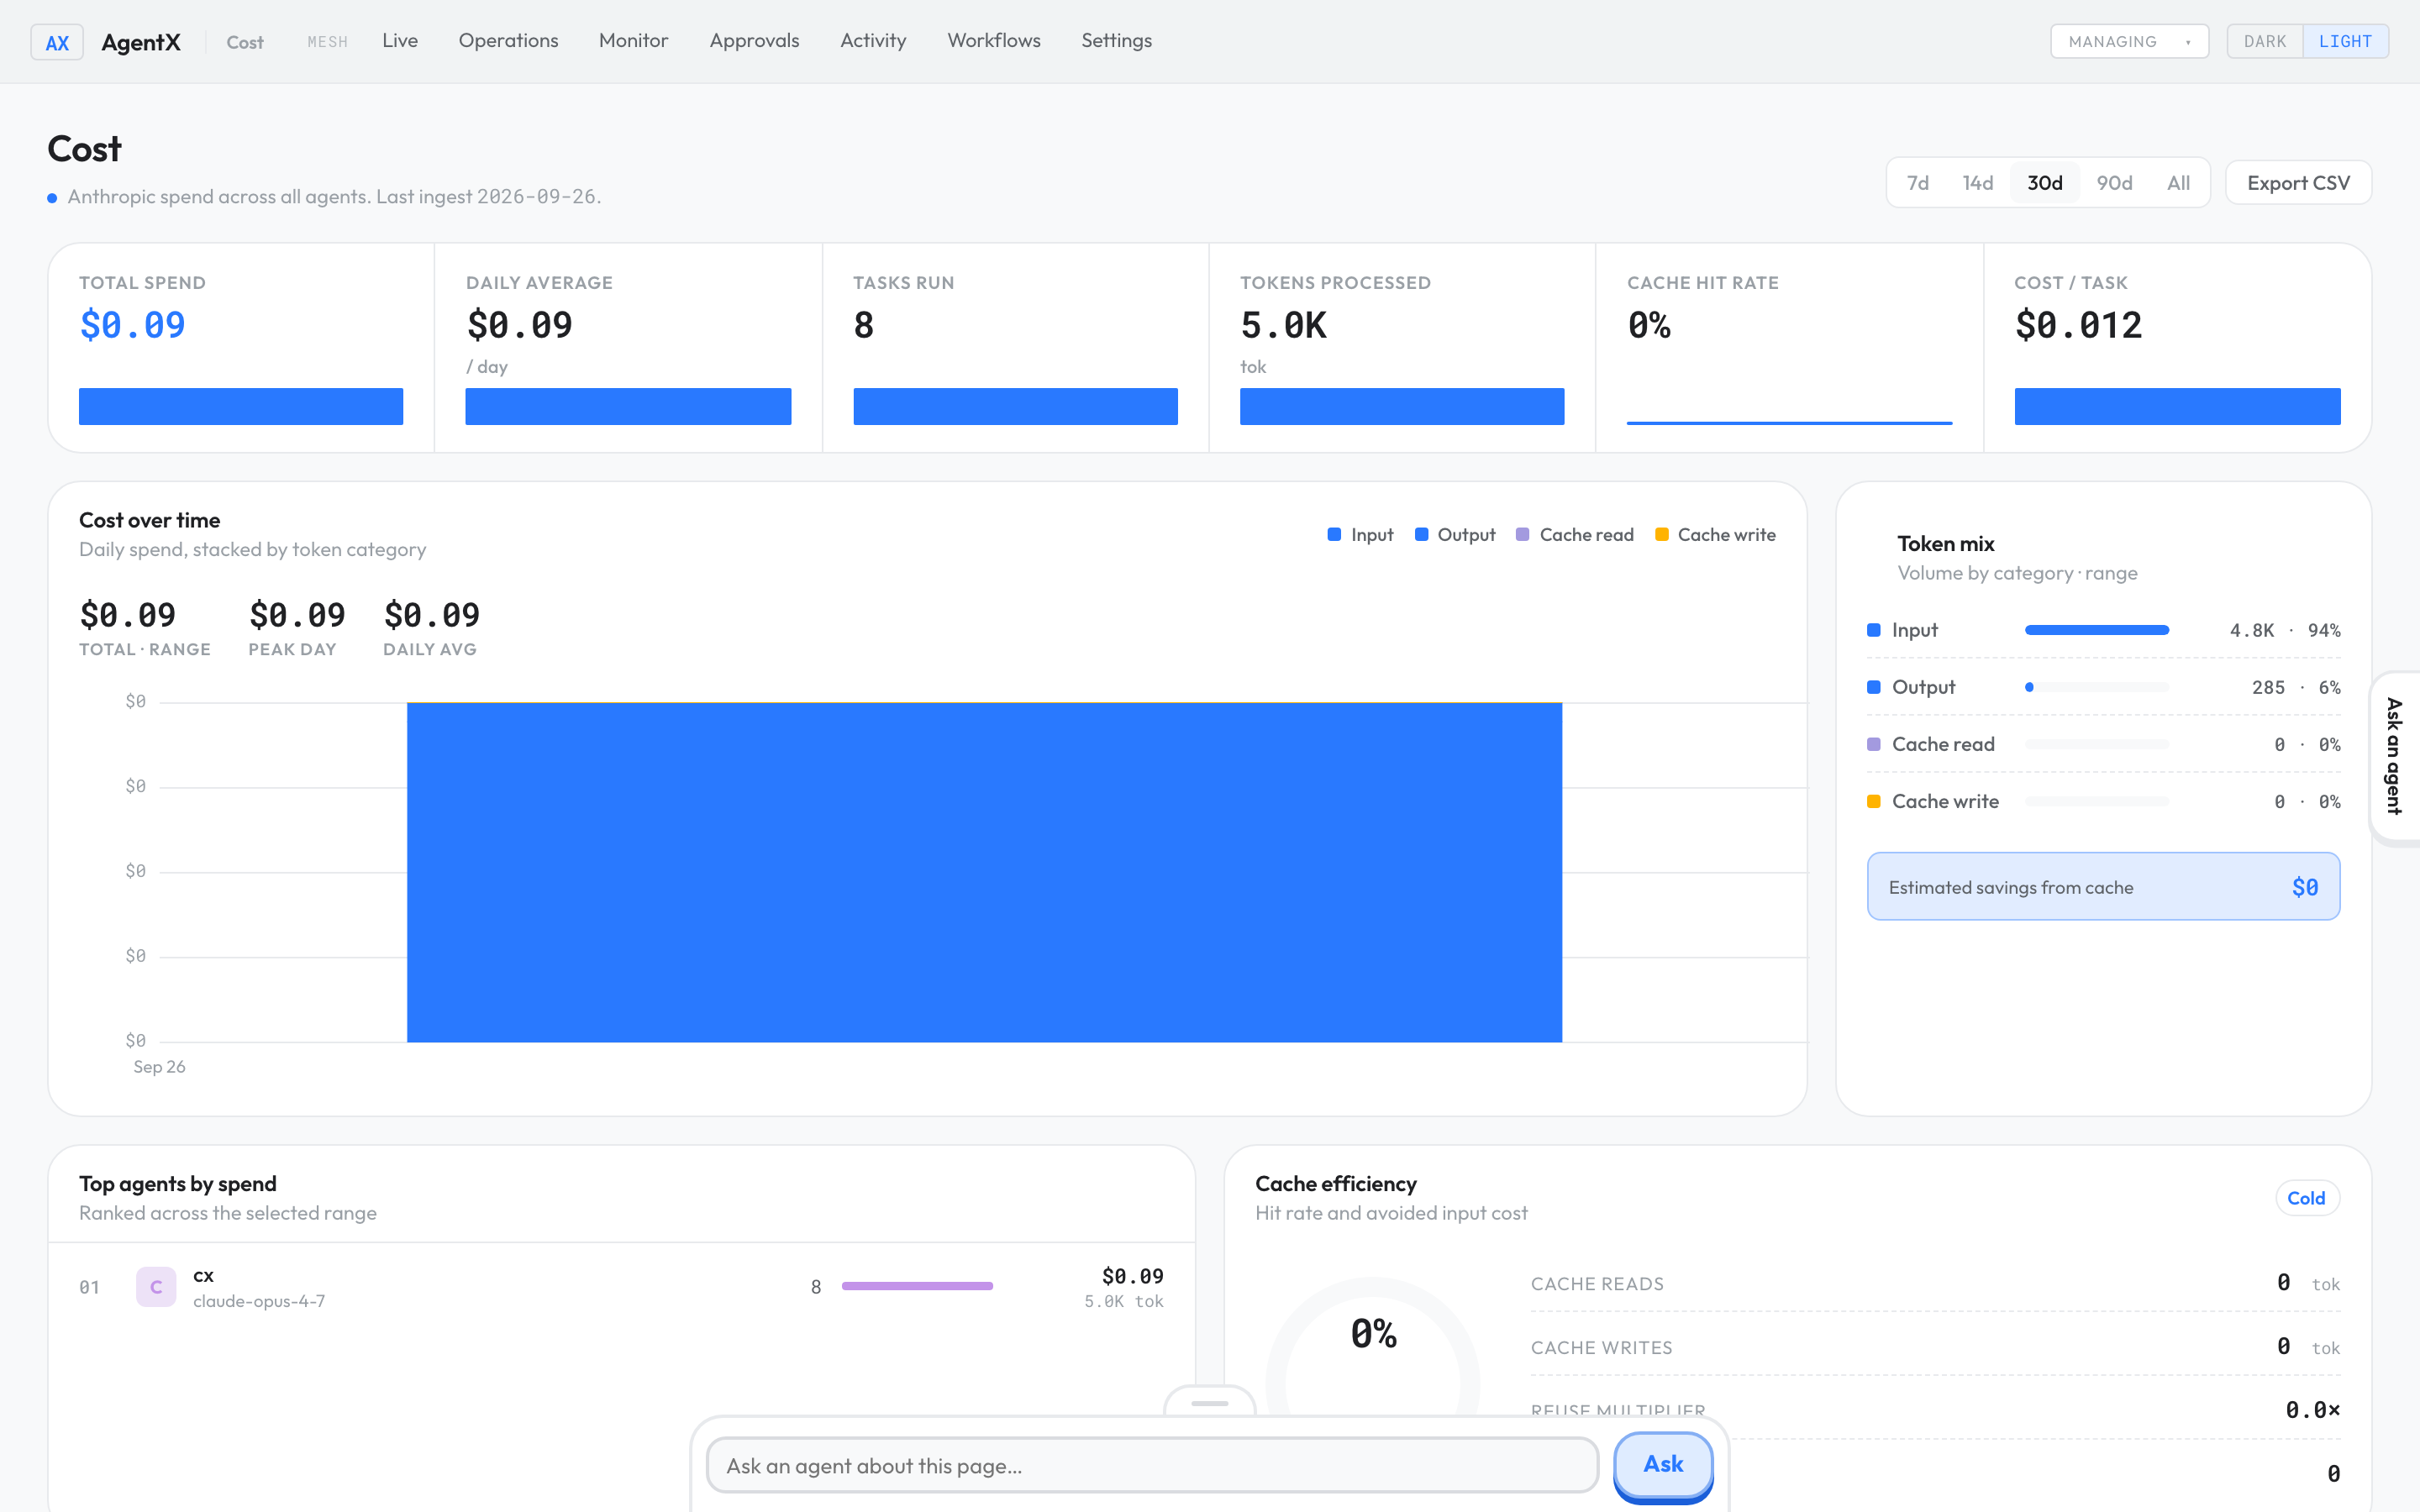
The Cost page shows Anthropic spend. Compare it with your provider's bill; the provider's figure is the one you pay.
See token use from the terminal
A token is a small piece of text, roughly three quarters of a word. Providers charge per token read and written.
- Terminal: run:sh
agentx usage - Read the totals for the last 7 days, then the list By Agent, largest first.
The daemon (the AgentX background service) must be running for this command to work.
agentx usage is short for agentx usage today. Despite the name, both show the last 7 days.
Get a detailed token report
agentx usage report answers "where did the tokens go, session by session?". It goes further than agentx usage: it also reads the conversation files Claude Code keeps on this machine (under ~/.claude/projects), so it counts Claude Code work done outside AgentX too. It does not need the daemon.
It runs a small Python script, scripts/token-report.py, from the folder you are in. That script is in the AgentX source code, not in the package installed with npm, so run this command from a copy of the AgentX source code that holds your .agentx folder.
- Terminal: go to that folder.
- Terminal: run:shTo look further back, add
agentx usage report--dayswith a number of days (the default is 7):shagentx usage report --days 30 - Read the three parts of the output:
- AgentX Agent Usage (from daemon): one row per agent with tasks, input, output, cache read, cache write and total tokens, then a Cache hit ratio.
- Claude Code Sessions (from JSONL): sessions and tokens per project folder.
- Top 5 Expensive Sessions: the five largest sessions, with the start of the prompt that began each one.
- Open the saved copy: the last line prints
Report: .agentx/reports/token_report.md. That file holds the per-agent table.
Example output (shortened):
  AgentX Token Usage Report
  ...
  Agent                      Tasks      Input     Output    Cache R    Cache W        Total
  helper                        12     48,210      9,904  1,203,550     80,112    1,341,776
  reviewer                       3     11,030      2,417    301,229     20,448      335,124

  Cache hit ratio: 91.2%
See which commands and pages people use
agentx usage surfaces answers "which AgentX commands and dashboard pages does anyone actually open?". AgentX counts each use on this machine: the command name (such as guard log) or the page address (such as /live), never what you typed after it. The counts stay in the local database and are not sent anywhere. The daemon does not need to be running.
- Terminal: in the folder with
agentx.json, run:shIt lists CLI commands, then Dashboard pages, each with the number of uses and on how many days they were used, for the last 30 days.agentx usage surfaces - Optional: change the period with
--days, for exampleagentx usage surfaces --days 7. - Optional: show only one kind with
--kind clior--kind page. - Optional: list the commands nobody has used in the period with
--unused. It printsNever used in the last 30 days (x/y)and the command names. It lists commands only, not pages, so don't combine it with--kind. - Optional: add
--jsonto get the raw data for a script or a spreadsheet.
Example output (shortened):
  Surface usage — last 30 days

  CLI commands
      41  daemon status                 12d
       9  schedule list                  5d
  Dashboard pages
     130  /live                         22d
Counting only happens inside an AgentX folder (one with agentx.json or .agentx). Setting the environment variable AGENTX_NO_TELEMETRY turns it off.
Limit how often Claude Code agents start
If your agents use Claude Code with a subscription, AgentX limits how many fresh Claude Code sessions it starts, so a busy day doesn't use up your plan. A conversation that is already open always goes through. Two settings in agentx.json control this:
"session": {
  "maxClaudeCodeDispatchesPerHour": 80,
  "maxClaudeCodeDispatchesPer5h": 180
}
The values shown are the defaults. Lower them to spend less; raise them if you have a larger plan. Restart the daemon after changing them.
Check it worked
- Browser: open
/admin/cost. The page shows a Last ingest time and figures for the period you picked. - Terminal:
agentx usageprintsToken Usage (last 7 days)followed by a total. - Terminal:
agentx usage reportends withReport: .agentx/reports/token_report.md, and that file exists. - Terminal:
agentx usage surfacesprintsSurface usage — last 30 days. The commands you ran in the folder, such asusage surfacesitself, appear in the list.
If something is wrong
Daemon not running. Start with: agentx daemon start: start the daemon, then runagentx usageagain.Script not found: …/scripts/token-report.py:agentx usage reportwas run outside a copy of the AgentX source code. Go to that folder and run it again.Analysis failed. Is Python 3 installed?: install Python 3 so thatpython3works in the terminal, then run the report again.No surface usage recorded in the last 30 days.: nothing has been counted yet. Counting starts once this version has been running for a while, and only inside an AgentX folder. Check thatAGENTX_NO_TELEMETRYis not set.No tasks recorded yet: no agent has run yet on this machine. Send an agent a message first.- The Cost page is empty: it only counts work done since AgentX started recording on this machine. Pick All to see everything it has.
- The numbers don't match your bill: your bill also covers use outside AgentX, and providers may round or group charges differently. Use the provider's figure.
- Spending is higher than expected: check Settings › Schedules for jobs that run very often, and lower their frequency.