
The dashboard
The dashboard is the AgentX website that runs on your own machine. You use it in a browser to see what agents are doing and to change settings. It is a separate program from the daemon (the AgentX background service that actually runs the agents), so the dashboard can load while the daemon is stopped.
Open it
- Browser: go to the address printed by
agentx setup. It is normallyhttp://127.0.0.1:4202. - Select a tab in the top bar.
If nothing loads, start the dashboard yourself:
- Terminal: from the folder that holds
agentx.json, run:shagentx board serve - Keep that terminal open, and open the address again.
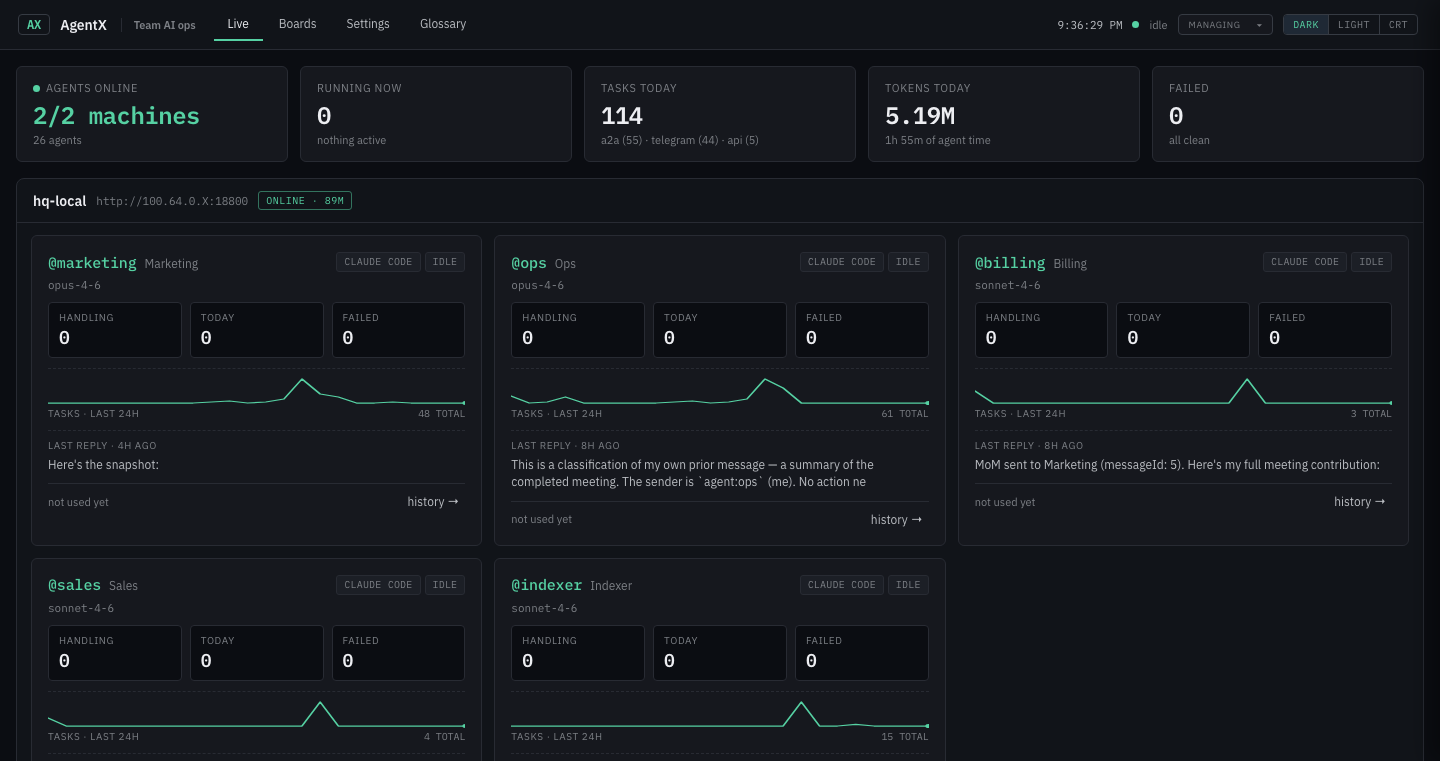
The top bar has seven tabs:
| Tab | What to look for |
|---|---|
| Live | Agents currently running |
| Operations | Work across connected machines |
| Monitor | What needs a person and what agents can handle |
| Approvals | Decisions waiting for your yes or no |
| Activity | What ran and the decisions it recorded |
| Workflows | Saved automations and the editor |
| Settings | Agents, channels, schedules, and connections |
Start in Monitor for an overview of the work, then open Activity when you need to look into a particular run. Some views stay empty until the matching app (for example GitLab) is connected. On the right of the top bar, Dark and Light switch the colour theme, and Managing picks which connected machine you are looking at.
Talk to your agents
Use in-page chat to ask about the current view. You can also work through the macOS desktop assistant or the OpenCode terminal UI.
To open the dashboard through your own web address, see Open the dashboard through your own web address.
Check it worked
- Browser: open
http://127.0.0.1:4202/live. The top bar shows the seven tabs. - Your agents appear on Live. If they do, the dashboard can reach the daemon.
If something is wrong
- The page doesn't load: the dashboard isn't running. Start it with
agentx board serve, or runagentx setupagain. - The page loads but shows no agents: the daemon is stopped or unreachable. Terminal: run
agentx daemon status. See It's not answering. - The page looks out of date after an update: the dashboard is a separate program. Stop it and start it again.
- You changed the port: the address uses
dashboard.portfromagentx.jsoninstead of4202.